A precision design is the standard SSRS report designer following the same principles, rules and requirements as are found in a SQL Server Business Intelligence Studio SSRS designer.
We will again use the same example of printing Customer Id, Customer name and Balance but this time instead of creating an Auto Design we will use Precision Design.
I will also show how we can use some inbuilt parameters to display some generic information like page number, execution date and time etc.
Here we will use the same AOT query created in previous example Build and Deploy Simple Report–Queries: SKL_SampleCustomer
Create the Required Dataset
- Open the previously created Report Model

- Right click on report model, select Add –> Report. Name the report SKL_SampleReportPrecision
- Set the report title to “Customer balance”

- Now in the report, go to the Datasets section and create new Dataset using the name Customer
- In the query property, click the button

- This opens up the query selection box to select a Microsoft Dynamics AX Query
- From the list select “SKL_SampleCustomer” and click Next
- Here you can select required fields. Either you can select all fields or a subset
- Expand All Fields nodes under the CustTable node to select “AccountNum”
- Expand Node “All Display Methods” and select “name” and “openBalanceMST”
- Click “Ok”
- Now Right click on the designs node, select Add and then “Precision Design”. This creates a new Precision Design and name it as PrecisionReport

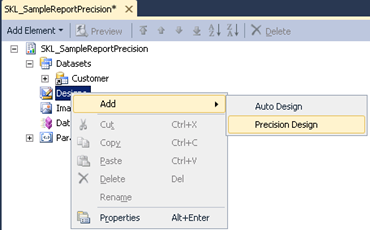
- Now right click on new Design and select “Edit Using Designer”

- This opens up the SSRS Designer (same as standard SSRS)
- You can see the standard Report Item tool bar from where you can drag and drop the controls onto the designer surface
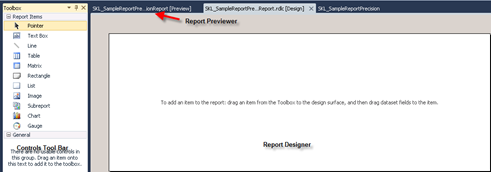
- Now from the controls tool bar, drag and drop the Table control onto the Report Designer
- Select the Tablix and then set the DataSetName property = “Customer”

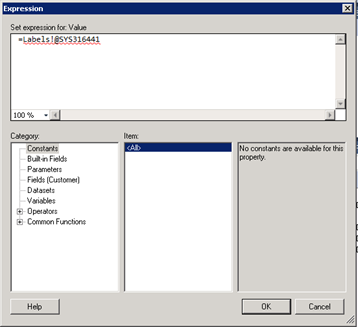
- Now let us specify headers, Select one text box in the header section and right click, then select “Expression…”

- In the expression editor, you can see lot of sections for Variables, Parameters, Fields, Datasets etc.
- Here write the following in the space “Set expression for: Value” - =Labels!@SYS316441
- This displays the header text using the labels in AX. This label is “Customer”
- Now again specify the values in Second and third text boxes in header row
- 2nd Column Header(Name) : =Labels!@SYS117778
- 3rd Column Header (Amount): =Labels!@SYS62867
- Now in the data row, move the mouse to first text box and you should see a button on the right side that looks as shown below

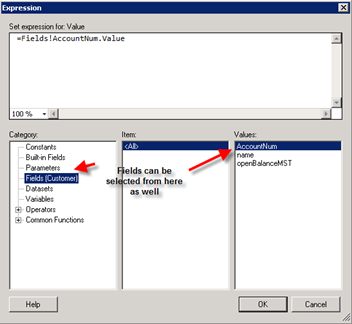
- Click the button and it displays the list of fields from the dataset, select required fields

- Alternatively, you can right and use “Expression…” box to specify the data fields. The expression box looks as shown below:
Now that the data is ready, we will go ahead and change the look and feel of the report
Formatting the table
You can specify the lots of formats using the properties windows like Background color, Font type color etc. You can also use the formatting tool bar above to format the data

Go ahead and specify the borders for the table for each row. Then change the background of the Header row. Make the text in the header row as center aligned and make the font as bold
Select the table rows one by one and change the font to “Segoe UI” and Font Size to “8pt”. Now your table looks as shown below:

Now we will go ahead and a Page Header and Page Footer. In Page Header, we will add Report name, Report Title and Execution Date and Time. In the Page Footer, we will add the Page Numbers in the format (Page of Total Pages)
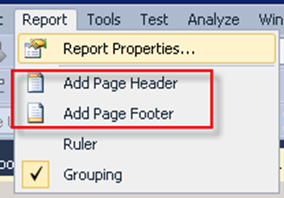
To enable Page Header and Footer, in the Report menu select “Add Page Header” and “Add Page Footer” options
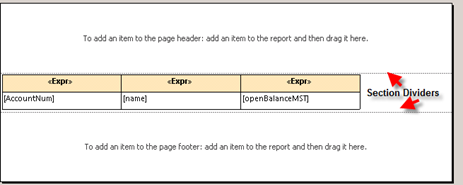
Now drag three text boxes from tool box and drop onto the Page Header area. Place two text boxes on the left hand corner and one on the right hand corner as shown below. Drag and drop one text box in the center of the Page footer as shown below.
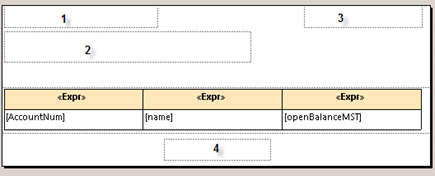
Select the first text box, Open the expression box and in the Category section, select “Built-in Fields. Now double click on “ReportName” field and it should add the report name to value section
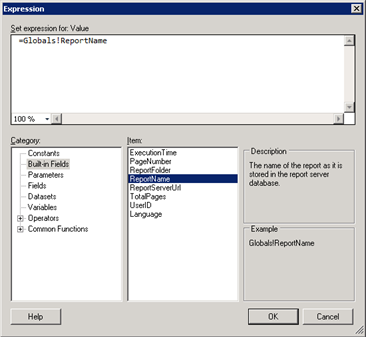
In the same way select “ExecutionTime” in third text box. For report title, Type in “Customer balances” in the second text box
In the footer section, select the 4th text box and type the expression ‘=Globals!PageNumber & ” of ” & Globals!TotalPages’
Apply formatting as required. Now you should see the design as follows
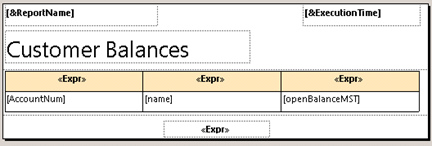
Now close the designer, add the report back to AOT (along with the model) and deploy the report from within AOT.
Create a new menu item
Go to AOT –> Menu Items –> Output, Right click and select “New Menu Item”. Set following properties
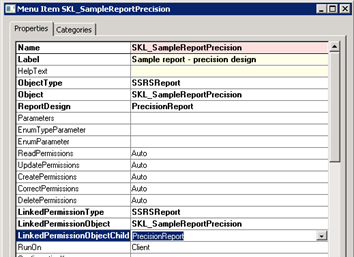
Now run the report and the report will be seen as shown below:

No comments:
Post a Comment